They oil a 20-24 fine. 6100 uses the same oil pumpWow that runs very strong!!!! I love to see and hear them sing and then stretch those legs and go to work. What a surprising little 50cc saw. I am impressed with its torque, a 50cc with a 20 pulling it well!!
How well does it oil a 20"?
You are using an out of date browser. It may not display this or other websites correctly.
You should upgrade or use an alternative browser.
You should upgrade or use an alternative browser.
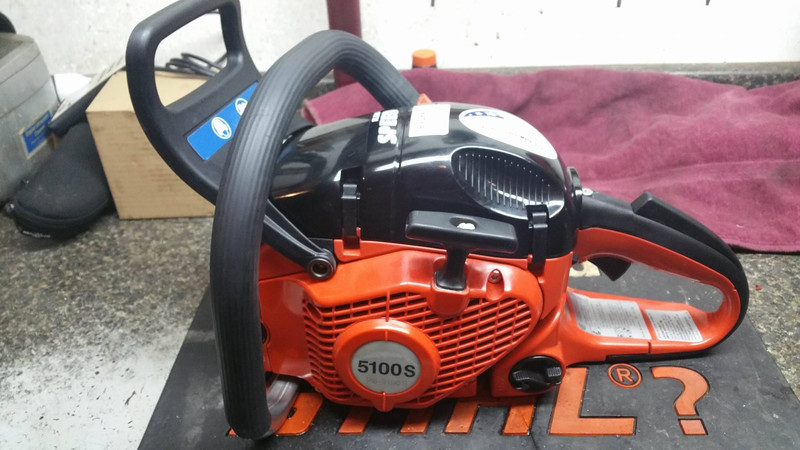
Snellerized Dolmar 5100S
- Thread starter blsnelling
- Start date


Help Support Arborist Forum:
This site may earn a commission from merchant affiliate
links, including eBay, Amazon, and others.
Full Chisel
Slingin' Stihls and runnin' Huskies
Nice work Brad...that's one stout 50cc!
Chris-PA
Where the Wild Things Are
On the first and second cuts with the smaller log I got 12,3000rpm. For most of the duration of the second cut it was a very narrow spike, meaning the rpm did not vary much.
The first cut on the large piece is at 11,500rpm, and pretty consistent in rpm over a 20sec period through the wide part of the log. That's not too shabby for 50cc in ash. What chain is on it - 0.325" or 3/8?

The first cut on the large piece is at 11,500rpm, and pretty consistent in rpm over a 20sec period through the wide part of the log. That's not too shabby for 50cc in ash. What chain is on it - 0.325" or 3/8?
.325 full comp. I don't have a small mount 3/8 bar or would have used it. 5100s seem to like 3/8.Impressive!
What B&C setup other then 20" length?
3/8" or .325", full comp?
I could like me a 5k Dolmar!")
I do not have either a 261 or 550.How would you compare it to a 261 or 550?
BTW now you got me real sad that I sold mine!
7
It's been several years since I last ported one of these. At the time I did not have a lathe or a right angle grinder. This one got a .020" popup and more transfer work than I could do at that time. I am very pleased with how this saw turned out. It has fantastic torque, RPMs, throttle response, idle, and starting. This is all the saw most any firewood hack would ever need. I do love me some 50cc saws!
Point of interest: Be VERY careful how much you lower the cylinder. I dropped this one about .026". It's covered, but is right at the point of free porting at the bottom of the exhaust port skirt when at TDC. A little free porting doesn't kill a saw, but it's certainly something you try to avoid. BTW, compression was 195 after the initial warm up and cool down to burn off the assembly lube.
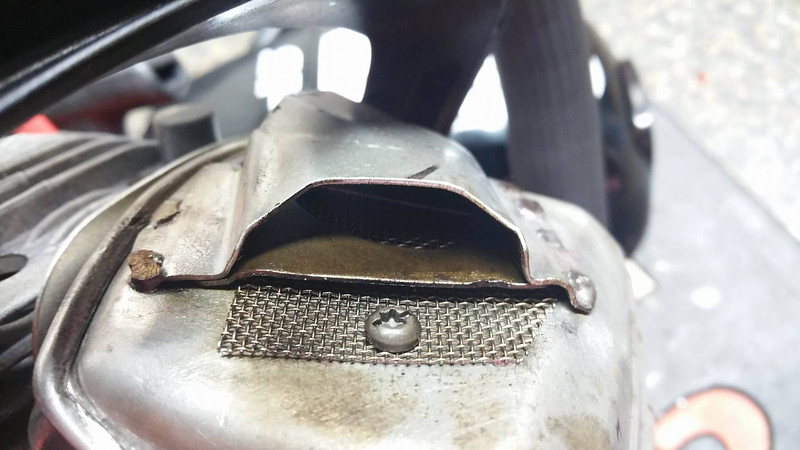
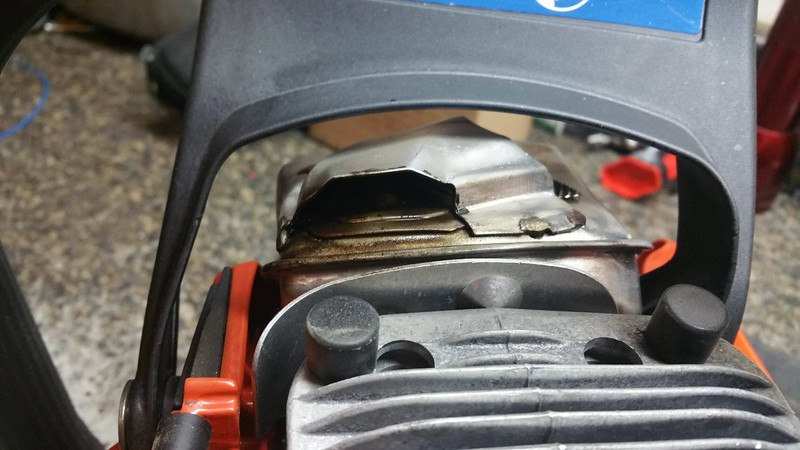
The muffler is a bit of a pain to mod on this saw. I drilled the spot welds out of the deflector and removed it. I opened up the hole underneath significantly. While the deflector was off, I removed the baffle at the end of the internal cage. I then welded the deflector back on and cut a new wide mesh screen for it.
RE: Vid. #3 where you are setting-checking the tune. I noticed that after you had set the tune the second time, you slightly let off pressure in the cut in the same manner in which you "check the tune in the cut" when dealing with an unlimited coil. Did you do this just out of habit or to see if you were hitting the limiter or?? Just out of curiosity, at what point do you hit the limiter?
Four Paws
Addicted to ArboristSite
I am very pleased with how this saw turned out. It has fantastic torque, RPMs, throttle response, idle, and starting.
Nice videos as always, Brad.
That saw needs more chain.
On the first and second cuts with the smaller log I got 12,3000rpm. For most of the duration of the second cut it was a very narrow spike, meaning the rpm did not vary much.
The first cut on the large piece is at 11,500rpm, and pretty consistent in rpm over a 20sec period through the wide part of the log. That's not too shabby for 50cc in ash. What chain is on it - 0.325" or 3/8?
View attachment 488794
How are you checking RPMs from a video??? I see some graphs which suggests to me that maybe it has something to do with sound measurement or??
If it is just Hocus- Pocus or probably beyond understanding to my simple mind
 , go right ahead & say so. I won't be offended. I'll just crawl back in my little hole & hibernate some more!
On the first and second cuts with the smaller log I got 12,3000rpm. For most of the duration of the second cut it was a very narrow spike, meaning the rpm did not vary much.
The first cut on the large piece is at 11,500rpm, and pretty consistent in rpm over a 20sec period through the wide part of the log. That's not too shabby for 50cc in ash. What chain is on it - 0.325" or 3/8?
View attachment 488794
What are you getting at 1:43? How about at 1:50?
Poleman
Addicted to ArboristSite
The other difference I've found is the newer cylinders have cleaner lower transfers and don't need as much work.
I don't cut the base at all because of the closeness of free porting just the squish to get between. 017-. 019. I've ended up with 205 compression that way.
These saws are torque monsters and I run 24" -3/8th on mine.
Their fun!!!!
Good job Brad!!!!
I don't cut the base at all because of the closeness of free porting just the squish to get between. 017-. 019. I've ended up with 205 compression that way.
These saws are torque monsters and I run 24" -3/8th on mine.
Their fun!!!!
Good job Brad!!!!
Red Elm
Ridgerunner
Yep, 24" 3/8s on one of mine too.
Chris-PA
Where the Wild Things Are
It is just an audio spectrum plot - the program I'm using plots the frequencies in the recording, and you can see the spike representing the fundamental rpm, as well as the harmonics at integer multiples above that. You can select a section of the recording that you want to look at - which can be long, such as the 20sec section I looked at here. You move the cursor to where you want and read the frequency off the display, then just multiply the frequency by 60 to get rpm. It was documented here: http://www.arboristsite.com/community/threads/measuring-rpm-from-video.281228/How are you checking RPMs from a video??? I see some graphs which suggests to me that maybe it has something to do with sound measurement or??
If it is just Hocus- Pocus or probably beyond understanding to my simple mind
It has been controversial among some who are not familiar with it, although it is a routine technique used in all sorts of things. Some people think it's something I invented, which is laughable.
What are you getting at 1:43? How about at 1:50?
I used a 2sec window centered at those points:
1:43 13020rpm
1:50 10860rpm
Nice! That's virtually what I was seeing on my tach.I used a 2sec window centered at those points:
1:43 13020rpm
1:50 10860rpm
Chris-PA
Where the Wild Things Are
Good! A typical tach will have a 1/2sec update time, so there can be some apples to oranges effects when comparing to this technique. Fast response can be good, but 1/2sec is getting to the limits of human ability to read, and you can easily end up focusing on a peak or dip at a glance. I think a longer term average is more useful.Nice! That's virtually what I was seeing on my tach.
You are good at keeping a steady pressure in your videos, so it makes for more consistent results.
How would you compare it to a 261 or 550?
BTW now you got me real sad that I sold mine!
7
I sold mine as well and I have no regrets, don't miss it at all. I never could warm up to that saw, didn't feel right and I hated that Stihl style master control switch on it, even if Dolmar did make there master control switch work in the right direction.
I found out when out cutting with my son, my old muffler modded Poulan 3000 would cut just as fast if not faster then my 5100 would and felt much better to me so down the road it went.
Brad seems to have made some great improvements to it though.
It is just an audio spectrum plot - the program I'm using plots the frequencies in the recording, and you can see the spike representing the fundamental rpm, as well as the harmonics at integer multiples above that. You can select a section of the recording that you want to look at - which can be long, such as the 20sec section I looked at here. You move the cursor to where you want and read the frequency off the display, then just multiply the frequency by 60 to get rpm. It was documented here: http://www.arboristsite.com/community/threads/measuring-rpm-from-video.281228/
It has been controversial among some who are not familiar with it, although it is a routine technique used in all sorts of things. Some people think it's something I invented, which is laughable.
I used a 2sec window centered at those points:
1:43 13020rpm
1:50 10860rpm
Thanks for the explanation & the link. Somehow I had'nt seen that thread. I learned something new tonight
.
While tuning the 346XP, I hit metal and had to file the chain, so these times can't be compared to those from Saturday.
My initial reaction after running both saws was that the 5100 beat my 346 badly. It feels that strong in the wood. I was so convinced, that I tore the topend off my 346 before going in the house to time the cuts. I've been wanting to go back in it anyway.
Imagine my surprise when cut times showed that the 346 was faster! This is just another example of how what someone thinks is faster means nothing until they put a stop watch on it.
You'll notice that my 346 is tuned on the lean edge. I only do that when going for cut times. That's a disadvantage to the 5100. I won't dare try to tune the 5100 on the edge when cutting wood this size, simply because I can't tune it by ear and verify it in the cut. The rev limiter kicks in before that point. In the real world, it doesn't matter. I'm not going to run a saw that lean when actually doing work.
You'll also notice that the wood was a little cleaner for the 346 cuts.
I've not yet played with ignition timing. I've been told by at least one other that they don't like it, but I still want to try it before calling this saw done.
With all of that said, I think this 5100 makes a better all around firewood saw. While it's not faster, it's definitely torquier, and it's plenty fast enough. I really like operating this saw.
Some builders don't like to do direct comparison videos for fear of making one saw look inferior to another, and thereby hurting the reputation and sales of port work on said models. I've never been one to pull punches on saw performance. I've done my best here to demonstrate how these two saws compare, and then verbally give you my assessment of how they might compare in actual use. I hope you are able to get a fair picture with what I've shown and said here.
Brad is that wood ohio pine ?
We dont have that here in pittsburgh.
We dont have that here in pittsburgh.
Yes, half rotten tooBrad is that wood ohio pine ?
We dont have that here in pittsburgh.
